Operations & Civic Data · Walmart ACC 7377 · Summer 2025
Walmart QC Dashboard
At Walmart’s Automated Consolidation Center 7377, I partnered with Engineering and Operations leadership to optimize label placement and printing workflows and start up the site’s first live label-quality monitoring system, built entirely with Microsoft Power Automate and Power Apps on the tools available at the local site.
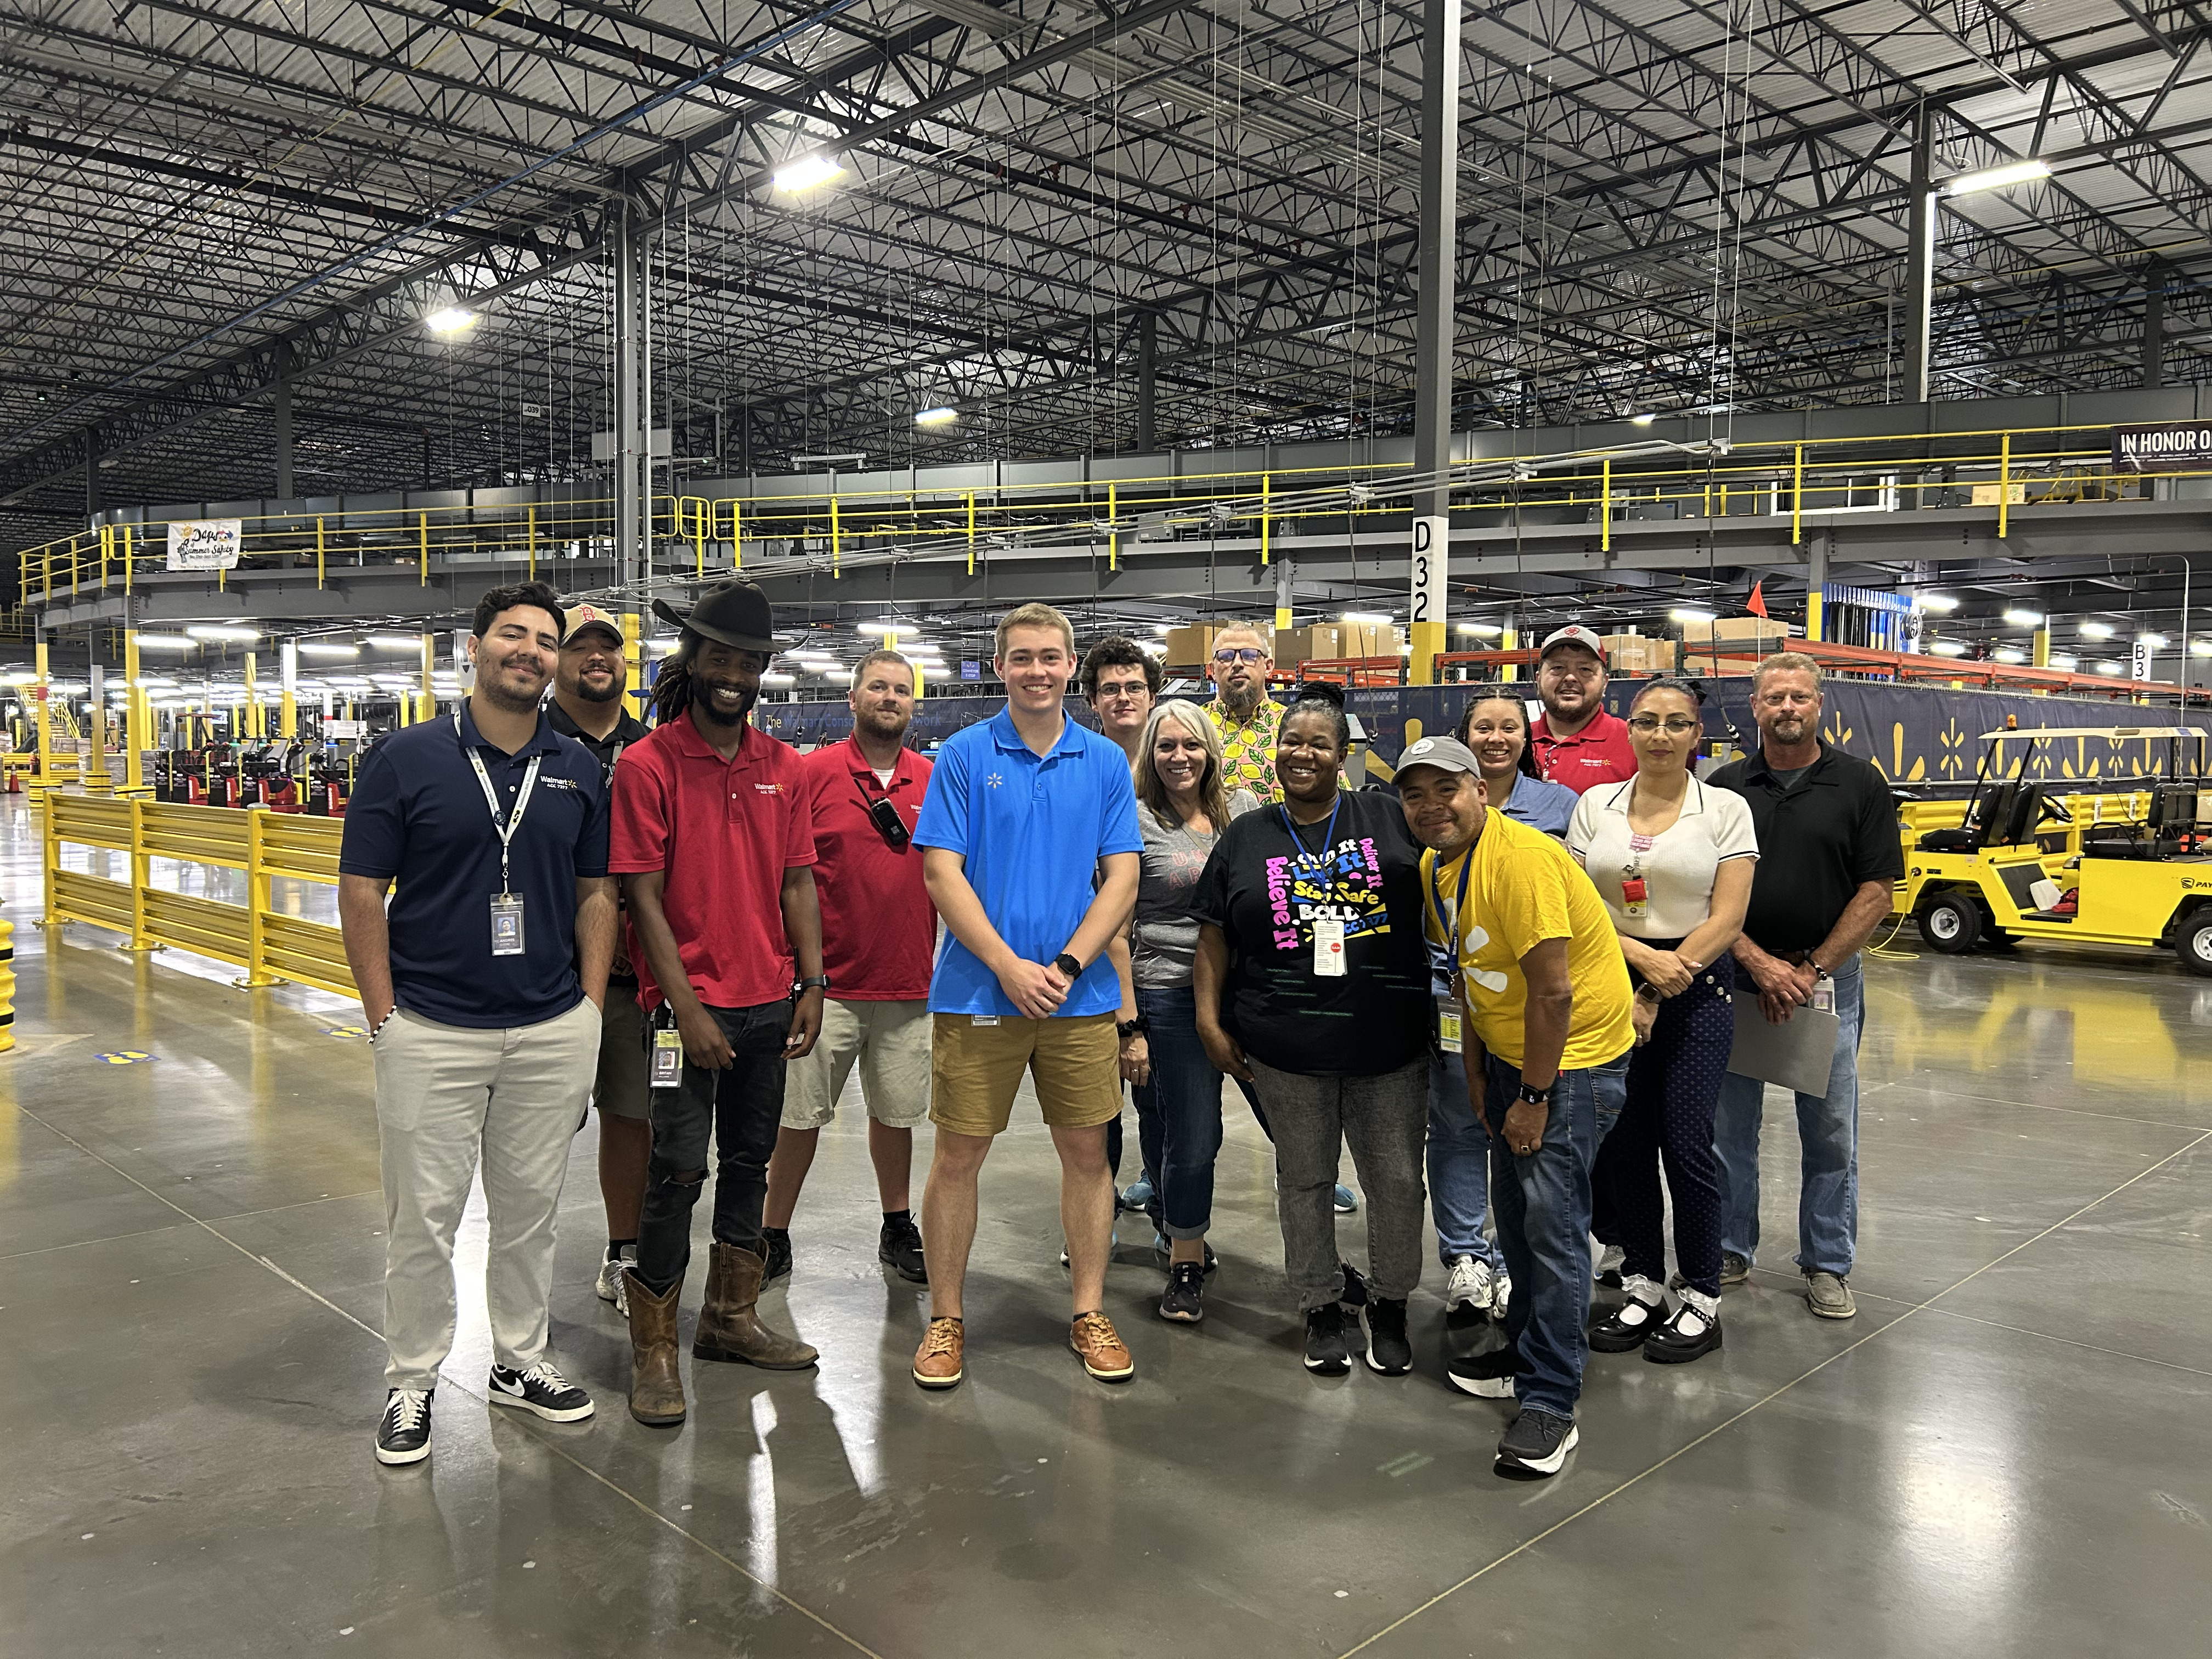
Collaborators
Greg Beard (SSE Engineer) · Andri Sarmiento (Operations Manager), ACC 7377.
Problem
ACC 7377 runs high-volume label printing and placement across consolidation workflows. Before this project, label-quality checks were largely manual and reactive; misprints and misplacement often surfaced late, after rework, downtime, or shipping risk had already accumulated. There was no centralized, real-time view of label quality by shift, line, or defect type, which made it hard for Engineering and Operations to prioritize fixes or measure whether process changes were working.
Enterprise BI stacks (e.g. BigQuery and Looker Studio) were in use elsewhere in the organization, and I learned those workflows alongside colleagues, but this project had to run at the local ACC level, without BigQuery access, so the solution was scoped to Power Platform tooling already available on site.
Approach
Phase 1: Floor discovery & process mapping
- Shadowed label printing and placement workflows with Engineering and Operations on the floor at ACC 7377.
- Mapped where labels fail today: print quality, placement accuracy, timing in the workflow, and handoffs between teams.
- Defined which events needed to be logged automatically vs. captured by associates, and what “pass” vs. “fail” meant for each check.
- Validated the problem statement and success metrics with Greg Beard and Andri Sarmiento before building anything.
Phase 2: Power Automate flows & quality logic
- Built Power Automate flows to collect label / print / QC events from floor inputs and existing operational data sources available at the site.
- Automated pass/fail quality rules, including defect flags, rollups by shift and line, and refresh triggers so leadership could see issues while the shift was still running.
- Replaced ad hoc spreadsheet tracking with repeatable flows that associates and supervisors could trigger without leaving their workflow.
Phase 3: Power Apps dashboard & rollout
- Designed a Power Apps dashboard that surfaced live label-quality metrics and automated the checks that had previously been done manually.
- Built views for both Engineering (root-cause and trend analysis) and Operations (shift-level pass rates and immediate action items).
- Rolled out on site with floor validation; changes were tested directly with engineering and operations leadership, not only in a back-office demo.
- Documented the process so it could scale to additional shifts and other consolidation centers.
Results
- Deployed the first live label-quality monitoring system at ACC 7377.
- Generated an estimated $6,000 in cost savings in week one compared to the same period in 2024.
- Moved QC from reactive manual checks to automated, near-real-time monitoring leadership could act on during the shift.
- Established a repeatable playbook (process mapping → Automate flows → Apps dashboard → floor validation) designed for scale across shifts and ACCs.
What I’d do next
Extend monitoring to additional shifts and benchmark week-over-week defect rates by line; add Automate alerts when defect rates cross thresholds; and package the app and flow templates for rollout at other consolidation centers. Where enterprise data access is available, the same QC logic could feed into a centralized warehouse, but the local Power Platform stack proved the concept on the floor first.