Browse My Favorite
Projects
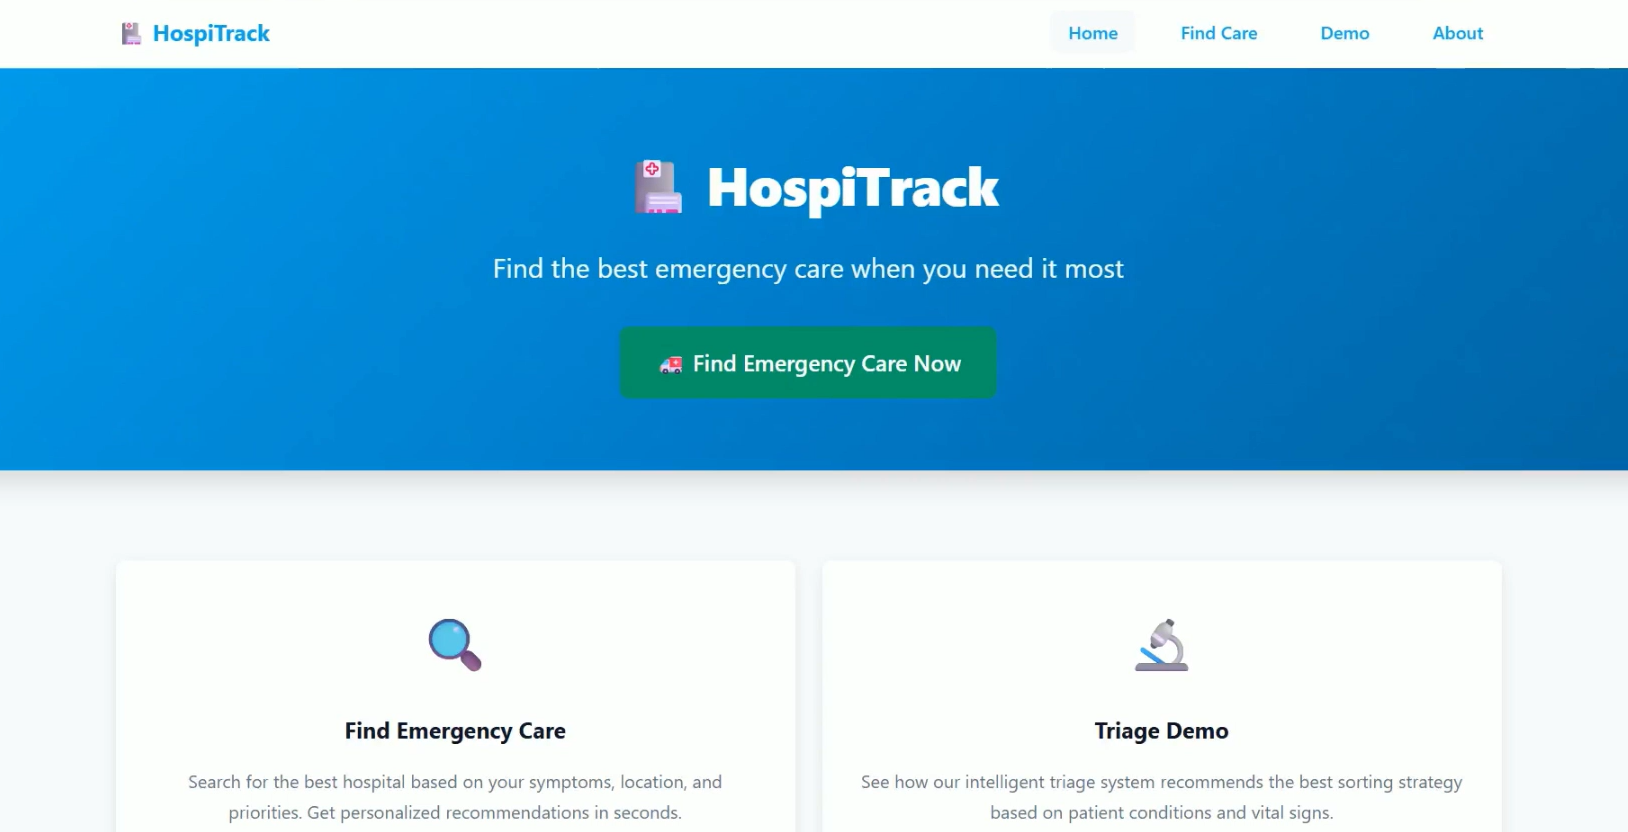
HospiTrack — ED & Clinic Finder (Production-ready)
HospiTrack is a production-ready web application designed to help patients across the U.S. discover and evaluate nearby Emergency Departments (EDs) and walk-in clinics. Built with a robust Python and FastAPI backend, the application serves a clean, simple HTML front-end, pairing a modular architecture with an intuitive user interface. Its primary goal is to surface clinically and operationally relevant information, empowering users to make faster, more informed decisions during urgent-care situations.
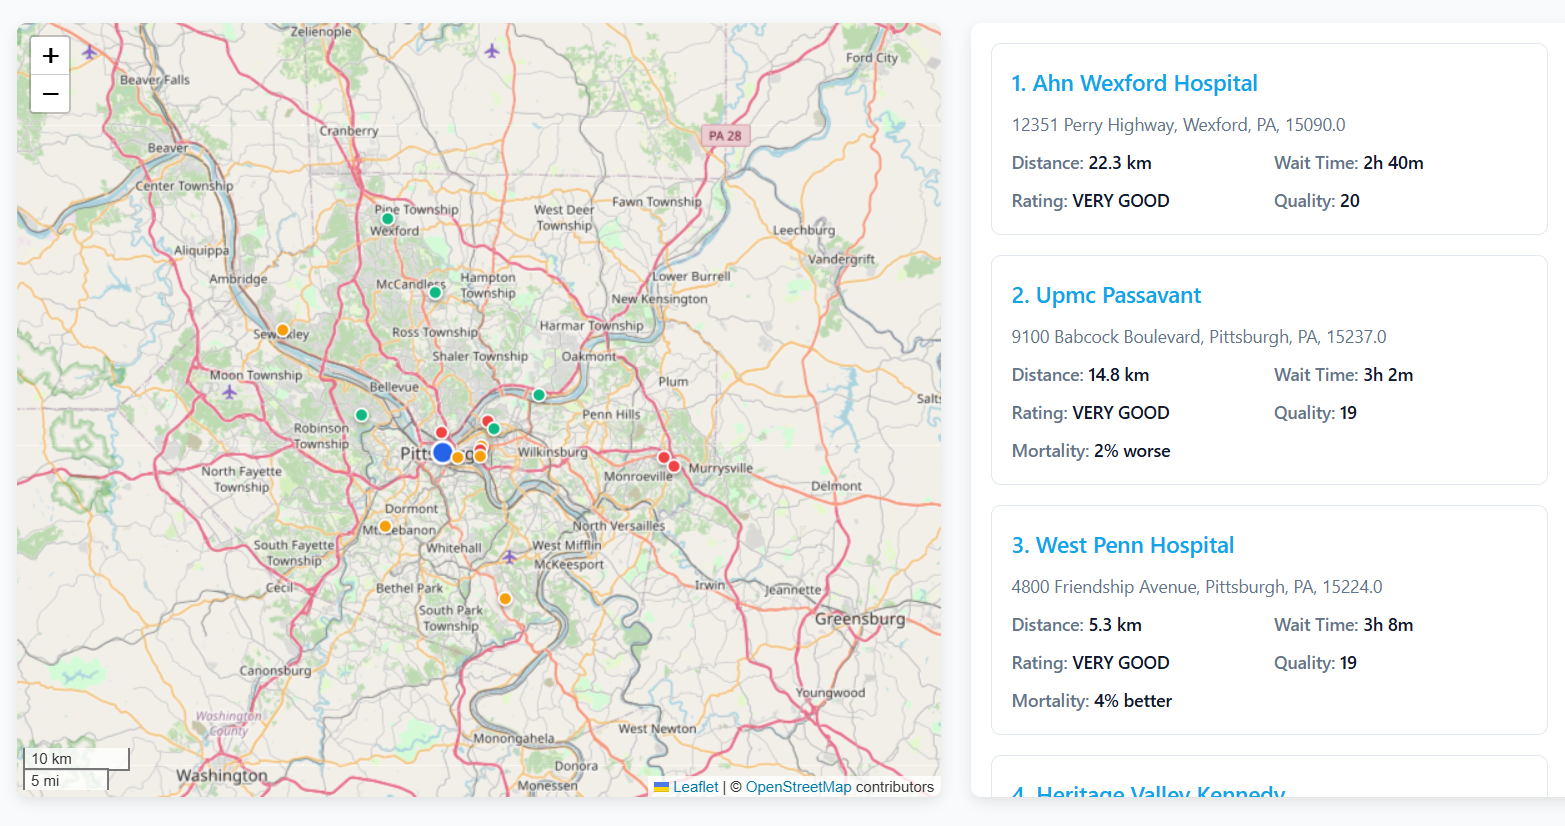
The core of the user experience is an interactive map where patients can either enter an address or provide geographic coordinates to center their search. From there, HospiTrack identifies all nearby facilities within a specified radius, presenting at-a-glance metrics for each location. These vital statistics include estimated ED wait times, patient experience ratings, and comprehensive quality and mortality performance indicators. To help users find the best fit for their needs, the platform offers powerful sorting options, allowing users to rank facilities by ED efficiency, patient satisfaction, overall quality, or mortality rates. For more targeted searches, users can also filter results by state.
On the technical side, HospiTrack features a sophisticated data ingestion pipeline that combines web scraping of hospital statistics (using requests and BeautifulSoup) with API integrations for CMS and Medicare data to provide deep clinical context. This disparate data is then consolidated into a single, geocoded dataset and stored both as a human-readable CSV and a compressed Parquet file for fast transfers and querying. The project is containerized with Docker and includes a utility script to reproduce the environment from local development to production.
Tech stack: Python, FastAPI, Docker, requests, BeautifulSoup, CSV / Parquet, (Leaflet / Mapbox for map UI), CMS / Medicare APIs.
EY 2025 Data Science Challenge
This GitHub Repo contains Jonah Zembower and Benjamin Nicholson's work from the EY Data Challenge 2025: Predicting Urban Heat Islands. We built a predictive machine learning model to identify Urban Heat Islands (UHI) using remote sensing and iterative Machine Learning pipelines. Over the source of the project we leveraged a variety of satellite imagery, geospatial data, and machine learning models to accurately predict UHI values. Our model achieved a final accuracy of 0.9606, ranking 86th globally out of over two thousand participants.
Time Series Analysis
Individual project that was done with various datasets related to time series analysis. The datasets on GitHub are as follows: Dinosaur Park, Sunspots, Electricity Consumption, and Webiste Traffic. I was able to do ARIMA modeling for each dataset, but I also found better methods that would work for the specific datasets and explained why that would be better for predictions. I hope this information can be potentially helpful for any workers related to some of the subjects such as sunspots, electricity consumption, or website traffic. Here is a presentation that I did to showcase the findings of the sunspots data.
Customer Segmentation/Image Analysis
Creating clusters for various types of customers based on the insights found in the dataset. Also, I looked at potential image analysis from various images found in a marvel dataset. This presentation showcases some of the findings of performing clustering.
Disease Prevention Analysis
This project included datasets based on networks of people in the population, and the relative disease spread. I was able to show potential options that would indicate different methods of combatting the disease spread and helping overall health care complications.
Full-Scale Database Implementation Proposal
My group's final project for Database Management Systems where we used a fictional company Flix2You (a movie distribution company) to propose a full-scale database planning and implementation process.
Predictability of Life Expectancy
Looking at the predictability of life expectancy of 183 countries related to various variables from data collected at WHO. Used multiple linear regression techniques for the predictability of various variables in life expectancy. The analysis was categorized into one year, 2015, first. Also, I did a total data analysis of 2000-2015 data.
My GitHub Repositories
Explore more to see all my projects and contributions on GitHub.